Introduction
If you're running browser automation in production, your provider's latency is part of your Service Level Agreement (SLA) whether you like it or not. We decided to compare four hosted browsers on real Puppeteer flows. Below, you'll find the exact metrics we measure, the code we use to measure them, and how you can run the same benchmark against your own stack.
We've designed this as an evergreen benchmark: the methodology and code will stay stable, and we'll keep refreshing the numbers as we periodically rerun the tests.
Why we did this
In 2026, "hosted Chrome" is a crowded category. Browserless, Anchor Browser, Browserbase, Hyperbrowser and others all give you a WebSocket endpoint and offer fast, reliable sessions.
In theory, they look the same, however, in practice they operate very differently:
- New connections add startup latency.
- Every new page adds overhead for multi-step flows.
- Finally, and likely most importantly, navigating to the site in question and “loading the page” are crucial.
If you're running thousands of jobs per hour, those milliseconds can turn into slower user-facing features, lower throughput per worker, and higher infra spend for the same end results.
We built this benchmark so you can see, in concrete terms, how different providers behave under the same Puppeteer script, and then reuse the same harness with your own URLs and configuration.
I had another motive as the founder of Browserless: To understand how we compare to the other tools in the market. We're always looking to improve our solution, so if this benchmarking ever highlights a key gap for us, we'll want to fix it. If you find it useful, let us know or star the repository!
What we're measuring
The benchmark tracks three points in a simple Puppeteer lifecycle:
- Connecting
- Opening a page
- Navigation
Connection speed
What it is: Time from calling puppeteer.connect to having an active browser session over the provider's WebSocket endpoint. We don’t add in any SDK calls to set up these connections ahead of time, which you might want to consider as some platforms require this before connecting.
Why it matters: It's the “cold-start” cost for each new session, affecting workloads that spin up many short-lived sessions (scraping, QA checks, link monitoring, cron-style jobs).
Page creation speed
What it is: Time to create a new tab with browser.newPage() after you're connected.
Why it matters: Many real-world flows use multiple tabs (parallel crawls, login + dashboard, multi-step wizards). Slow page creation can be your bottleneck, even if the initial connection is fast.
Navigation speed
What it is: Time from calling page.goto(URL) to the navigation resolving for a shared target URL.
Why it matters: This is the part that feels like "waiting for the page to be ready". It bundles provider overhead (region, routing, session setup) with the target site's own performance.
Each metric is recorded as:
- Average: What you should expect most of the time.
- Fastest: A best-case run with minimal jitter.
- Slowest: The run in the batch that takes the longest to provide a simple view on tail latency.
The results
In the run we're publishing here, we benchmarked four providers:
- Browserless
- Anchor Browser
- Browserbase
- Hyperbrowser
As Browserless's founder, it’s great to see thatour headless browser performed well in every round, but we’ve made the code open source so you can run it yourself. Keep in mind that geography and location can make a huge difference to these metrics, which is why we maintain multiple data centers.
All times are in milliseconds. A lower bar is better.
Connection speed results
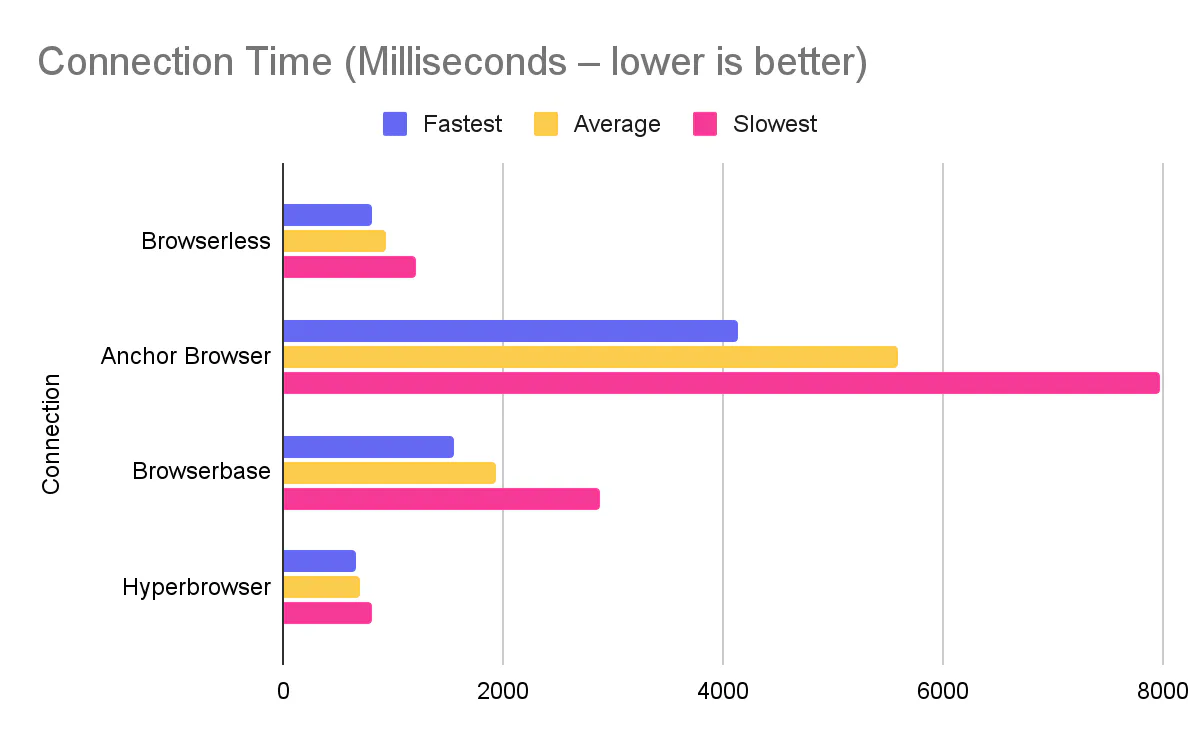
What this means in practice:
- Hyperbrowser connects the fastest in this run, with Browserless close behind and well under a second on average.
- Browserbase sits in the middle of the pack.
- Anchor Browser's connection time is several times higher than the others, which will hit workloads that open many short sessions.
Page creation speed results
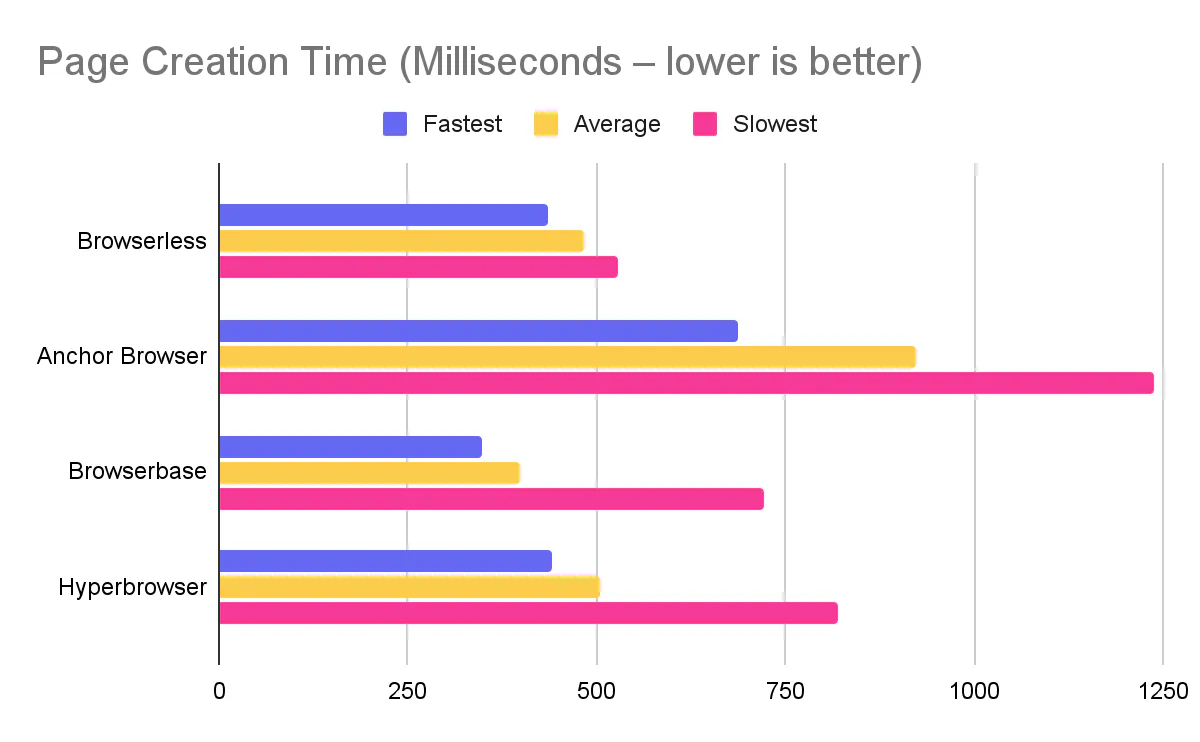
Takeaways:
- Browserbase is the quickest to open a new page in this run.
- Browserless and Hyperbrowser are close behind, both keeping page creation comfortably under a second.
- Anchor Browser shows roughly double the latency of the fastest providers for this step.
Navigation speed results
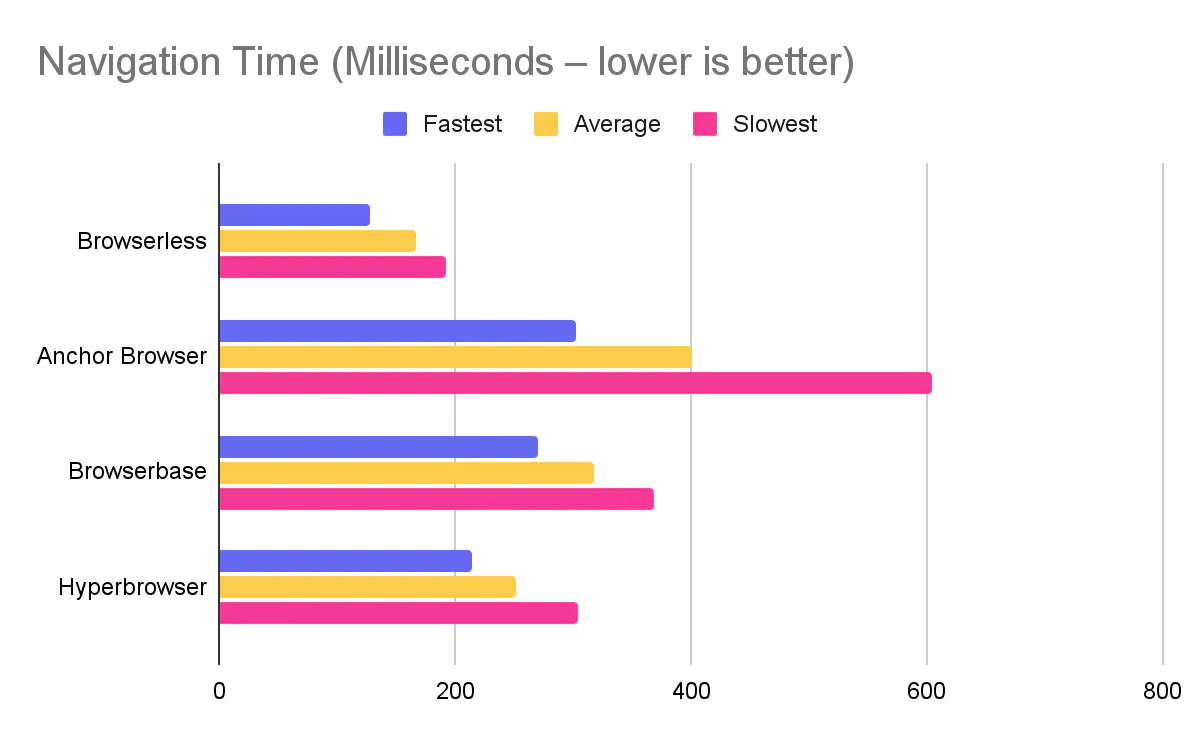
Here, Browserless is ahead:
- Browserless has the fastest average navigation time and a tight spread between fastest and slowest runs.
- Hyperbrowser and Browserbase follow behind, still sub-350 ms on average.
- Anchor Browser's navigation latency is roughly 2–2.5× Browserless's average in this test.
How to read these numbers
A few things to keep in mind when you interpret the tables:
- This is one benchmark configuration – same URL (www.example.com), same script, same region, repeated runs.
- The ranking and gaps are useful signals, but exact numbers will shift a bit as providers roll out changes and as we re-run the tests.
- Your workload will stress different parts of the stack (long-lived sessions, heavy pages, CPU-bound work). Use this as a baseline, then test with your own flows.
Our methodology
The benchmark is a small Node.js project built around puppeteer-core and a set of provider adapters.
At a high level, it does three things:
- Dynamically loads all providers from a providers/ directory.
- Runs the same Puppeteer flow multiple times for each provider.
- Logs timing statistics to the console in a consistent format.
Configuration
The configuration is driven by environment variables, loaded via dotenv:
# .env
TOTAL=10                     # how many runs per provider
URL=https://example.com/     # target URL for navigation

BROWSERLESS_API_KEY=...
ANCHORBROWSER_API_KEY=...
BROWSERBASE_API_KEY=...
BROWSERBASE_PROJECT_ID=...
HYPERBROWSER_API_KEY=...
You can tune TOTAL and URL without touching any code.
Provider adapters
Each provider has a small adapter in providers/ that knows how to create a session and return a WebSocket endpoint. If you want to add your own, then simply write a module with async “setup” and “teardown” functions. Even though they’re async, they won’t be calculated in the benchmarks being run. As an example, here’s browserless’ adapter:
Browserless:
// providers/browserless.js
import "dotenv/config";

const API_KEY = process.env.BROWSERLESS_API_KEY;

export const setup = async () => {
  return {
    browserWSEndpoint: `wss://production-sfo.browserless.io/?token=${API_KEY}`,
    provider: "Browserless",
  };
};

export const teardown = async () => {};
Browserbase:
// providers/browserbase.js
import { Browserbase } from "@browserbasehq/sdk";
import "dotenv/config";

const API_KEY = process.env.BROWSERBASE_API_KEY;
const PROJECT_ID = process.env.BROWSERBASE_PROJECT_ID;

export const setup = async () => {
  const bb = new Browserbase({ apiKey: API_KEY });
  const session = await bb.sessions.create({ projectId: PROJECT_ID });

  return {
    browserWSEndpoint: session.connectUrl,
    provider: "Browserbase",
  };
};

export const teardown = async () => {};
Hyperbrowser:
// providers/hyperbrowser.js
import { Hyperbrowser } from "@hyperbrowser/sdk";
import "dotenv/config";

const API_KEY = process.env.HYPERBROWSER_API_KEY;

export const setup = async () => {
  const client = new Hyperbrowser({ apiKey: API_KEY });
  const session = await client.sessions.create();

  return {
    browserWSEndpoint: session.wsEndpoint,
    provider: "Hyperbrowser",
    session,
    client,
  };
};

export const teardown = async ({ session, client }) => {
  await client.sessions.stop(session.id);
};
Anchor Browser:
// providers/anchorbrowser.js
import "dotenv/config";

const API_KEY = process.env.ANCHORBROWSER_API_KEY;

export const setup = async () => {
  return {
    browserWSEndpoint: `wss://connect.anchorbrowser.io?apiKey=${API_KEY}`,
    provider: "Anchorbrowser",
  };
};

export const teardown = async () => {};
The benchmark runner
The runner takes a setup and teardown function, then does the following for each run:
- Calls setup() to get browserWSEndpoint.
- Connects with puppeteer.connect.
- Creates a new page.
- Calls page.goto(URL).
- Records timings for each step.
- Closes the page and browser, then calls teardown().
A simplified version looks like this:
import puppeteer from "puppeteer-core";
import "dotenv/config";

const URL = process.env.URL;
const TOTAL = Number(process.env.TOTAL || 10);

const average = (arr) => arr.reduce((a, b) => a + b, 0) / arr.length;

export default async function runBenchmark(setup, teardown, name) {
  const stats = { connected: [], pages: [], navigate: [] };
  let browserVersion = null;

  for (let i = 0; i < TOTAL; i += 1) {
    const params = await setup();
    const { browserWSEndpoint } = params;

    const connectStart = Date.now();
    const browser = await puppeteer.connect({ browserWSEndpoint });
    stats.connected.push(Date.now() - connectStart);

    if (!browserVersion) {
      browserVersion = await browser.version();
    }

    const pageStart = Date.now();
    const page = await browser.newPage();
    stats.pages.push(Date.now() - pageStart);

    const navStart = Date.now();
    await page.goto(URL);
    stats.navigate.push(Date.now() - navStart);

    await page.close();
    await browser.close();
    await teardown(params);
  }

  console.log("\n=== Test configuration ===");
  console.log(`Provider: ${name}`);
  console.log(`Browser version: ${browserVersion}`);
  console.log(`Total runs: ${TOTAL}`);
  console.log(`URL: ${URL}`);
  console.log("==========================\n");

  console.table([
    {
      Metrics: "Connection",
      Average: average(stats.connected),
      Fastest: Math.min(...stats.connected),
      Slowest: Math.max(...stats.connected),
    },
    {
      Metrics: "Page creation",
      Average: average(stats.pages),
      Fastest: Math.min(...stats.pages),
      Slowest: Math.max(...stats.pages),
    },
    {
      Metrics: "Navigation",
      Average: average(stats.navigate),
      Fastest: Math.min(...stats.navigate),
      Slowest: Math.max(...stats.navigate),
    },
  ]);
}
The actual repo code follows the same structure, with some extra logging and provider discovery. One other piece of information this benchmark highlights is the browser version itself, which is critical to know about as browser improvements can make big differences in benchmarks and are, in general, a good security posture to have.
Why we plan to keep benchmarking
Hosted browser performance is not static. Providers change regions and routing, default Chromium versions, how they manage sessions and resources, and more.
We also ship improvements on the Browserless side: new regions, better caching, smarter orchestration, etc. – each of those can move your real-world timings up or down.
We’ll keep this benchmark up to date so everyone can catch regressions early, instead of discovering them after a rollout, sanity-check new providers before you depend on them and validate that Browserless stays fast for the patterns you care about.
Our goal is to keep the methodology stable and rerun this benchmark regularly so you have a current, honest view of how Browserless compares.
How to run it yourself
You don't have to trust our numbers. You can run the same benchmark in your own environment and point it at your own URLs.
At a high level, you'll:
-
Clone the repo and install dependencies:
git clone https://github.com/browserless/benchmarks.gitcd benchmarksnpm install -
Create a
.envfile:cp .env.example .envSet:
TOTAL– how many times to run the script per provider.URL– the page you want to navigate to.- API keys and IDs for the providers you want to test.
-
Run the benchmark:
node index.js
The script will:
-
Discover all provider adapters in
providers/. -
Run the benchmark for each configured provider.
-
Print a configuration block and a timing table per provider.
- Compare and extend:
- Drop the results into a spreadsheet or dashboard.
- Change
URLto match your actual workload. - Add new providers by creating new files in
providers/.
If you're already using Browserless, this gives you a straightforward way to validate that you're getting the latency you expect. If you're still choosing a provider, it gives you a reproducible, code-level way to compare them on the metrics that matter for browser automation.
FAQs
1. Which hosted browser provider has the fastest connection speed?
In our benchmark, Hyperbrowser had the fastest average connection time at 692.5ms, with Browserless close behind at 936.4ms. Browserbase averaged 1,929.9ms, while Anchor Browser was significantly slower at 5,582.4ms.
2. Which hosted browser is fastest for page navigation?
Browserless delivered the fastest navigation times, averaging 166.2ms with a tight spread between fastest (128ms) and slowest (192ms) runs. Hyperbrowser averaged 251.1ms, Browserbase 317ms, and Anchor Browser 401.6ms.
3. How do you benchmark hosted browser performance?
We measure three metrics using Puppeteer: connection speed (time from puppeteer.connect to active session), page creation speed (time for browser.newPage()), and navigation speed (time for page.goto() to resolve). Each test runs multiple times to capture average, fastest, and slowest results.
4. What is the best hosted browser for Puppeteer automation?
The best choice depends on your workload. For navigation-heavy tasks, Browserless showed the fastest and most consistent times. For workloads requiring many short-lived sessions, Hyperbrowser's fast connection times may be advantageous. Consider running the open-source benchmark against your own URLs and use cases.
5. Why does hosted browser latency matter for automation?
Hosted browser latency directly impacts throughput, user-facing feature speed, and infrastructure costs. If you're running thousands of jobs per hour, milliseconds compound into slower features, lower throughput per worker, and higher spend for the same results.
6. Can I run this browser benchmark myself?
Yes. The benchmark code is open source. Clone the repository, add your API keys to a .env file, set your target URL and number of runs, then execute node index.js. You can also add custom providers by creating adapter files.