Introduction
Memory leaks are one of those bugs that sneak up on users. Your app starts slow, uses more and more memory, and before you know it, things grind to a halt, but there’s no clear error or crash. Whether you're working in Python, Java, C++, or running automated browser sessions with Playwright or Browserless, these leaks quietly build up unused, allocated memory that never gets released. In this guide, we’ll break down how memory leaks occur, how to spot them, how to fix them, and, most importantly, how to avoid memory leaks in the first place, so your applications stay fast, stable, and scalable.
Understanding Memory Leaks
What is a Memory Leak?
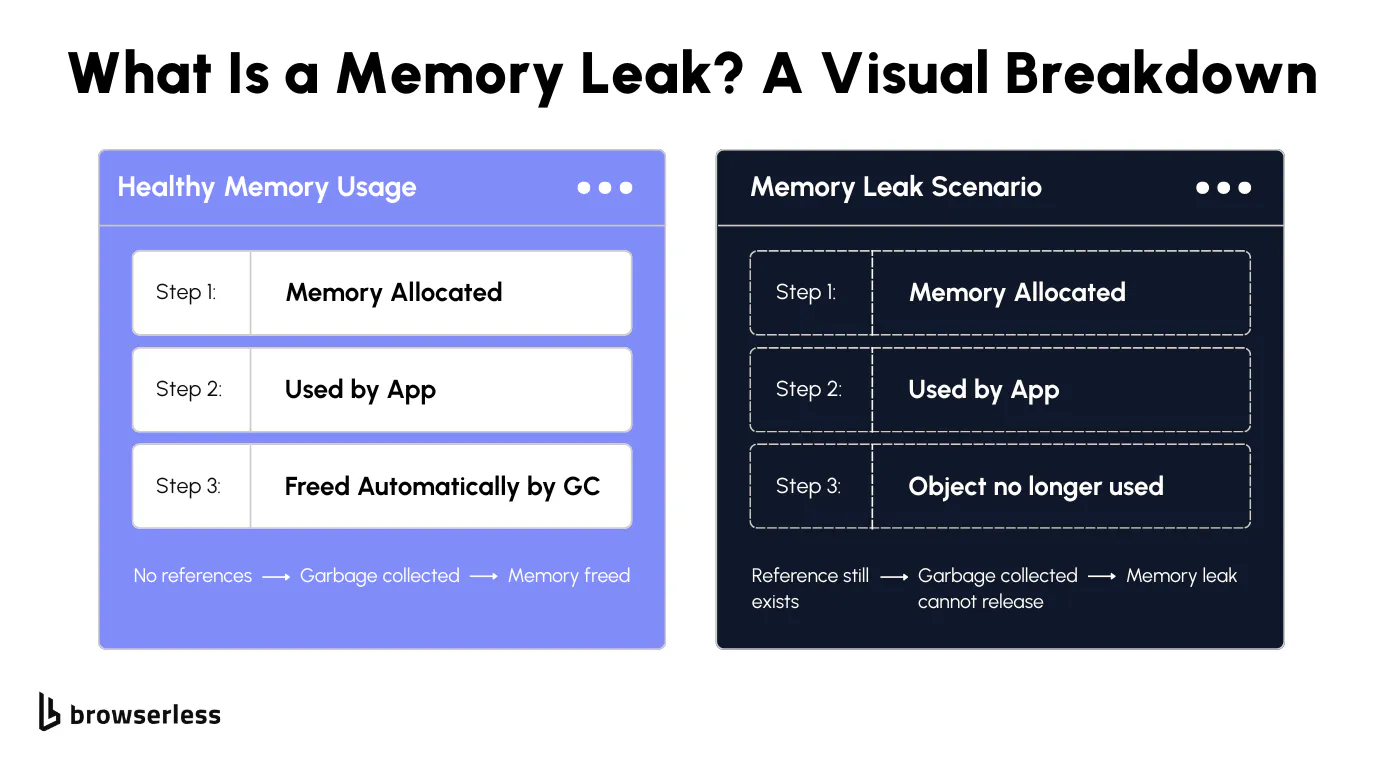
A memory leak happens when your application allocates memory for something like an object, array, or DOM node, or certain functions, but never frees it up after it’s no longer required. Over time, this unreachable memory begins to accumulate. Even though your program might still be running, that allocated memory is now lost, bloating your app and slowing everything down.
A memory leak can occur in various environments, including Python scripts, Java applications, C++ services, and even long-running browser sessions in Chrome or Playwright. In low-level languages like C++, forgetting to call free() or mismatching malloc() with delete can result in memory leaks quickly. In garbage-collected languages like Python or JavaScript, holding onto old references prevents the garbage collection system from doing its job.
If you’re wondering what this looks like in practice, here’s a simple example: a quick JavaScript example.
let leakedData = [];
function createLeak() {
  leakedData.push(new Array(1000000).fill("leak"));
}
setInterval(createLeak, 1000); // Your memory usage climbs every second
In this case, we continuously allocate memory without performing any cleanup. The program continues to run, but the memory consumption skyrockets.
The Signs You Might Have a Memory Leak
So how can you detect memory leaks before they crash your system? Thankfully, they leave some telltale signs:
- Your app feels slower the longer it runs.
- RAM usage in your operating system continues to grow, even when your app isn’t in use.
- You restart your service, and performance magically improves.
- The system becomes unstable or the program terminates unexpectedly under load.
If you're running browser automation scripts, you might notice your background tasks (like scraping jobs) start hanging or timing out. That’s usually a sign that more memory is being used on every run a classic memory leak scenario.
To track down the issue, a developer should monitor their memory usage using tools like Chrome DevTools, top, htop, or language-specific profilers, such as tracemalloc in Python.
Memory Leaks in Browser Automation
Here’s where things get especially interesting. If you’re working with browser automation using tools like Playwright, Selenium, or Browserless, you must be extra cautious. These tools spin up entire browsers in the background, and every tab or script adds to your memory usage.
Some common causes of memory leaks in browser automation:
- Not closing pages or browser contexts after use
- Holding references to large DOM elements
- Leaving event listeners or intervals running after tests complete
Here’s an example in Playwright that could leak memory fast:
// Dangerous pattern creates a new browser every loop without closing
while (true) {
  const browser = await chromium.launch();
  const page = await browser.newPage();
  await page.goto("https://example.com");
  // browser.close() is missing!
}
You’ll be leaking memory on every loop because the allocated resources are never released. To prevent memory leaks, always close pages and browsers properly, and use flags such as --disable-dev-shm-usage or --disable-cache when running in headless mode. Consider restarting your sessions regularly, especially if you’re using Browserless in production or CI.
How to Find and Fix Memory Leaks
How to Find a Memory Leak
Before you can fix a memory leak, you need to know it’s actually happening. The good news? There are several ways to identify one, whether you're debugging locally or monitoring a production system.
Start by watching your memory usage over time. Is your app steadily eating up more memory with each run? That’s a red flag.
In manual testing, try logging object counts, allocated memory, and process stats at regular intervals. Here's a super basic Node.js example:
let leakedData = [];
function createLeak() {
  leakedData.push(new Array(1000000).fill("leak"));
}
setInterval(createLeak, 1000); // Your memory usage climbs every second
For automated detection, use profilers or diagnostic tools built into your stack. Python has tracemalloc, JavaScript has Chrome DevTools, and Java offers the Eclipse Memory Analyzer. These help you track memory allocation, identify unreachable memory, and follow references that should’ve been garbage collected.
If you’re running automation or browser scripts in CI, check your logs for errors. Do scripts take longer? Does your program terminate unexpectedly? Those subtle changes may indicate that you're leaking resources between tests.
Tools to Help Detect Memory Leaks
To effectively detect memory leaks in programming, the right tools and regular code reviews make all the difference. Here are a few go-to options by platform:
- JavaScript / Chrome: Chrome DevTools' Performance and Memory tabs enable you to track snapshots and identify detached DOM trees a classic sign of a leak.
- Node.js: Use clinic.js, heapdump, or memwatch-next to generate memory snapshots and analyze allocation.
- Python: Try objgraph, tracemalloc, or memory_profiler to visualize object growth over time.
- Java: The Eclipse Memory Analyzer (MAT), VisualVM, and JProfiler help locate leaked memory from static variables or lingering references.
- C++: Valgrind and AddressSanitizer are essential for spotting leaks caused by bad malloc() / free() handling.
For browser-based automation tools like Playwright or Selenium, consider adding memory snapshots at the start and end of each test, then diff them to highlight unreleased resources.
Want to dig deeper? We cover more in our full guide on Finding Memory Leaks.
How to Fix a Memory Leak
So you've found a leak. Now what?
The fix depends on where and how the memory leak occurs, but here are some general strategies:
- Remove stale references: This is especially common in JavaScript and Python, when objects persist because something still references them. Clear timers, unsubscribe from event listeners, and clean up after closures.
- Close what you open: Leaking file handles, database connections, or browser tabs can cause memory allocation to be consumed. Always close() or dispose() what you're done with.
- Tune your garbage collection strategy: In languages with automatic garbage collection, hint at object lifecycles (e.g., using WeakMap in JS or weak references in Java).
- Break up long-living processes: If your program continues running indefinitely (like a worker or daemon), consider restarting it on a schedule or after N requests.
Here’s a real-world code snippet showing a fixed memory leak in Playwright:
// GOOD: Always closing the browser
const browser = await chromium.launch();
const page = await browser.newPage();
await page.goto("https://example.com");
await browser.close(); // Prevents memory leak
The sooner you catch and release memory, the better your app will scale and perform.
Is There Any Way to Recover the Data?
Unfortunately, in most cases, once you leak memory, the data is gone unless you have logging or snapshots in place. But there are a few techniques to help with damage control:
- Crash recovery: Tools like Node.js’ process.on('uncaughtException') or Python's faulthandler can capture diagnostic info before the application terminates.
- Memory dump analysis: Many profilers let you trigger a heap snapshot at crash time. Analyze it afterward to find what leaked and why.
- Proactive logging: Add guards in your code that track the amount of memory used over time to prevent memory leaks. Alert early if usage spikes beyond normal thresholds.
In automation environments, such as when using Browserless, Playwright, or CI pipelines, consider enabling verbose logging, capturing dumps, or restarting long-lived containers after completing heavy tasks.
Even if you can’t recover the leaked data, a solid logging setup ensures that the next time, you’ll catch the problem before it gets worse.
Best Practices for Memory Management
Preventative Strategies
If you’ve ever had to debug a nasty memory leak on your computer, you know it’s not enjoyable. These bugs don’t just show up and crash your app; they quietly drain your system’s available memory until things slow down, behave unpredictably, or completely fall over.
The good news? Most memory leaks are avoidable. A few simple habits can help you write code that’s smarter about memory allocation, more predictable over time, and easier to maintain, especially in automation-heavy environments.
Let’s start with the key things you should do:
Do This
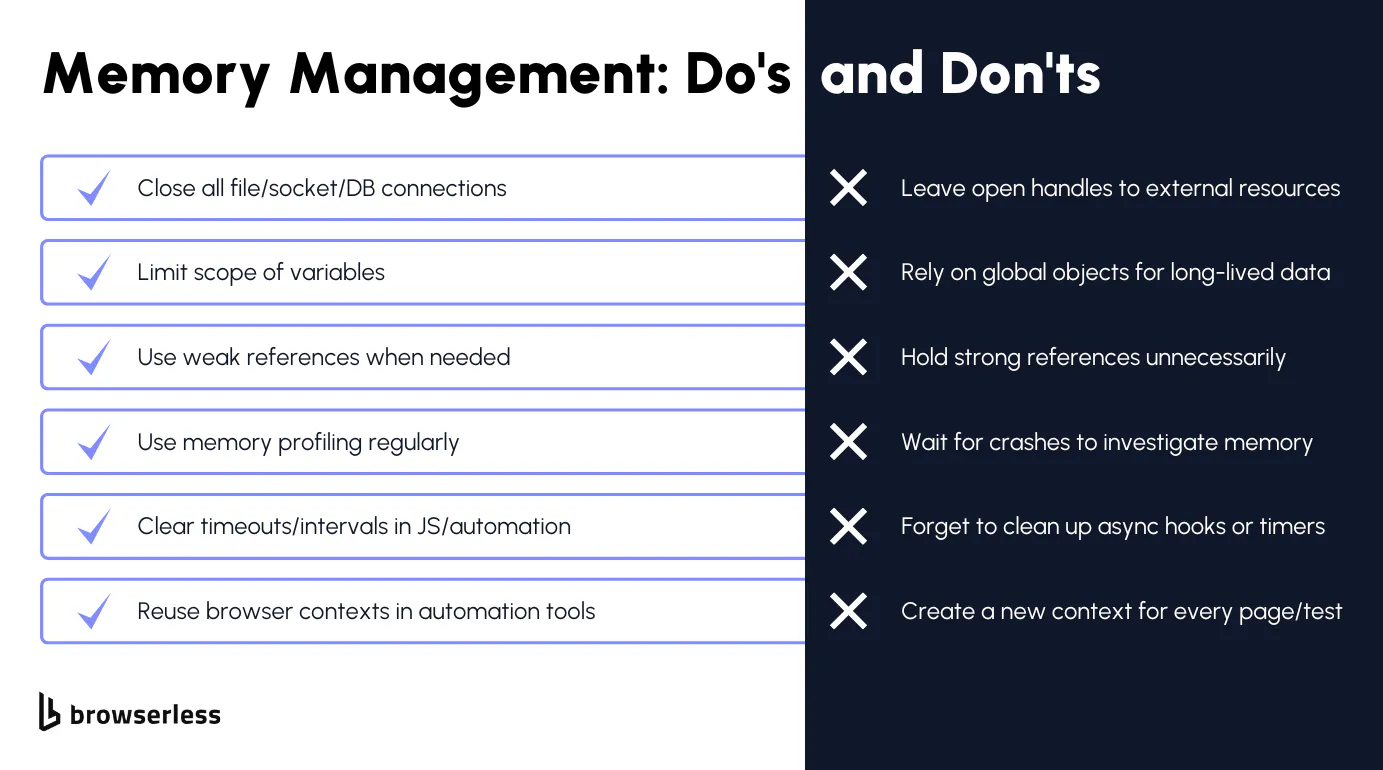
Close everything you open
Whether it's a file handle, a WebSocket, or a database connection, always close it when you’re done. Open connections that aren’t released will leak memory and tie up system resources over time.
Keep your variables scoped
Avoid global variables unless you absolutely need them. When you limit scope, your variables are easier to clean up and that means better control over allocated memory.
Use weak references when needed
If you’re working with large objects that don’t need to stay alive forever, weak references can help. They let the garbage collector clean things up once nothing else needs them, without requiring you to release memory manually.
Profile your memory usage regularly
Don’t wait for your app to crash. Use tools like Chrome DevTools, tracemalloc, or heap profilers to monitor your heap and memory consumption. Profiling helps you detect memory leaks early.
Clear timeouts and intervals
Forgotten setInterval() or setTimeout() calls can quietly consume memory in the background, potentially causing memory leaks and other issues. Always clean them up when you’re done.
Reuse browser contexts in automation
If you're using tools like Playwright, Puppeteer, or Browserless, don’t spin up a fresh browser or context every time your program runs. Reuse them when possible to keep your memory usage under control.
Now, here’s what you’ll want to avoid:
Don’t Do This
Don’t leave external handles open
Leaving a file or socket open is not a significant issue, but the allocated memory chunks never get released. Over time, they pile up.
Don’t store long-lived data in global objects
Global objects are convenient, but they persist indefinitely. That means anything you attach to them might never get cleaned up.
Don’t hold strong references unnecessarily
If you’re keeping references to big objects just because “you might need them later,” ask yourself if there’s a better pattern. Strong references prevent garbage collection, which leads to leaked memory.
Don’t wait for things to crash before profiling
A leak might take hours to break your system, but by the time your program terminates, it’s already too late. Check memory usage proactively.
Don’t forget to clean up async hooks or timers
This one’s sneaky. Event listeners, async callbacks, and timers can linger longer than expected, especially in headless scripts or long-running automation workflows.
Don’t create a new context for every browser test
Creating a new context for every page or test in tools like Playwright might seem harmless, but it’s one of the fastest ways to leak memory in automation.
Best Practices When Fixing a Memory Leak
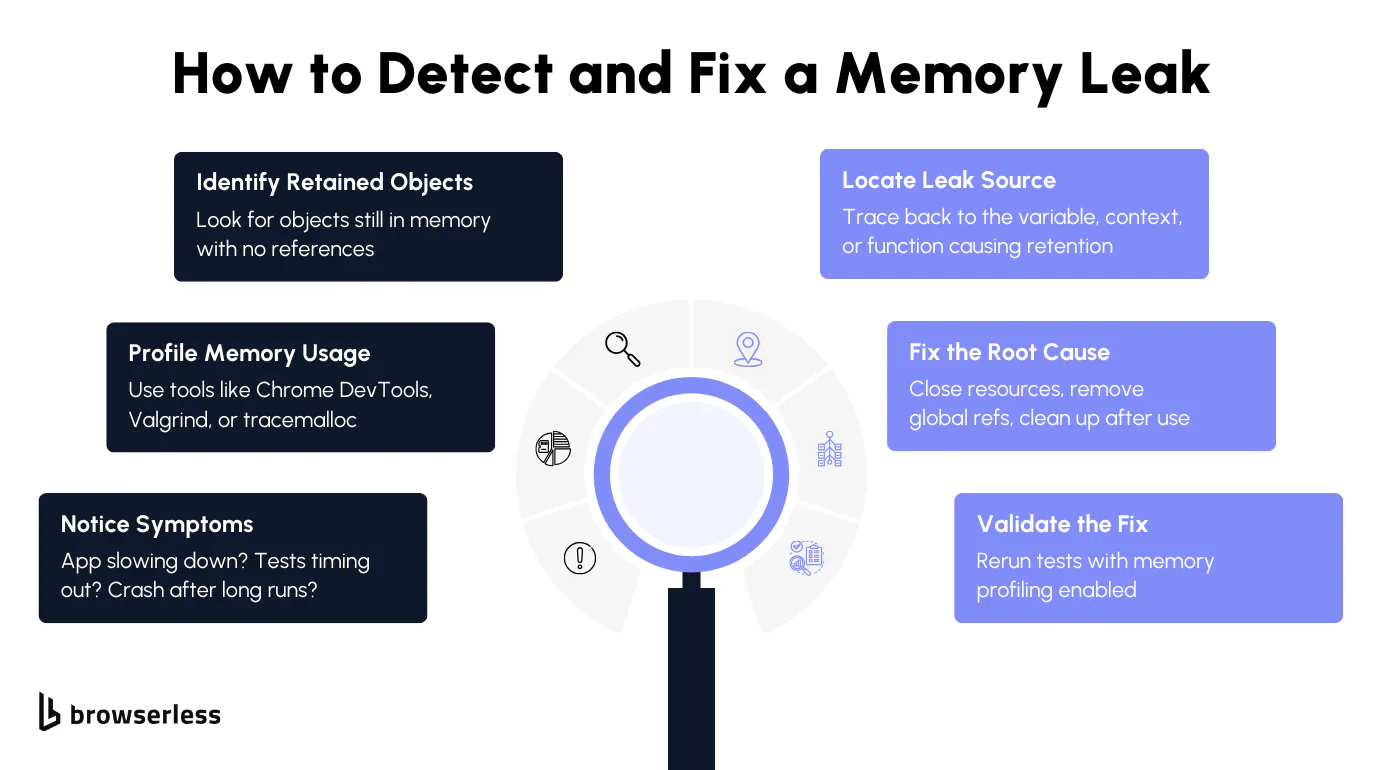
Finding and fixing leaks can be frustrating, but it’s a lot easier if you follow a methodical process. Here’s what usually works best:
First, confirm the leak is real run your code repeatedly under similar conditions to ensure consistency. Is memory usage going up every time? Is RAM never going back down? That’s your signal.
You don’t have to guess. Use memory profiling tools like:
- Chrome DevTools (JS/Browserless)
- tracemalloc (Python)
- VisualVM or Eclipse MAT (Java)
- Valgrind or AddressSanitizer (C++)
These help you inspect heap allocation, track objects, and find references that should’ve been cleared but weren’t.
Look at what’s holding on to memory that should’ve been released. Are you keeping data in memory longer than needed? Are browser tabs or network connections being left open? Fix the actual code, not just the symptoms.
After the patch, run the same test that caused the leak. Does memory consumption stay flat? Good. Add automated checks or logs that can alert you if things start to climb again.
Make profiling and code review part of your team’s regular workflow. Monitor heap growth in CI. Set memory thresholds for automation tasks. Make leak detection part of your process, not just a last resort.
Memory Leaks by Language & Platform
Memory Leaks by Language & Platform
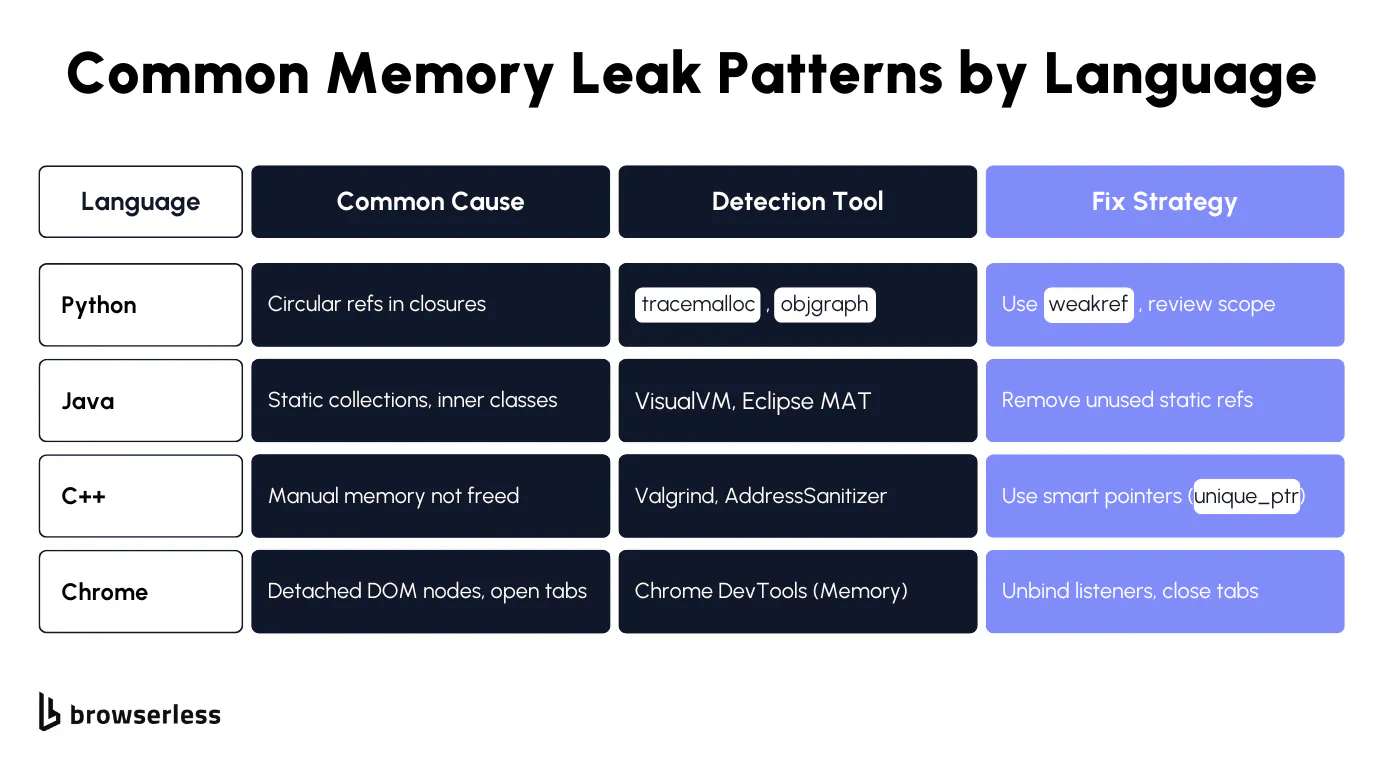
Memory leaks don’t play favorites; they can happen whether you're writing Python scripts, scaling Java services, building in C++, or just running a few tabs in Chrome. However, the way leaks appear (and how you track them down) depends significantly on the language or platform you're using.
Here’s a personal take on where things tend to go wrong and how you can stay ahead of it.
Memory Leaks in Python
Python does a lot of memory management for you, thanks to garbage collection, but it’s definitely not immune to memory leaks. In fact, some of the most common causes in Python stem from relatively innocuous-looking functions and code.
One of the biggest culprits? Mutable default arguments. You might’ve written a function like this before:
def append_item(item, my_list=[]):
    my_list.append(item)
    return my_list
It looks harmless, but that list persists across function calls, slowly accumulating allocated memory with no easy way to release it. Another one to watch out for is reference cycles, where two objects point to each other. Python’s garbage collector doesn’t always catch those unless you force it to.
Global variables are another trap. If you’re storing data globally for convenience, you’re also keeping it alive indefinitely, which can lead to memory leaks.
What to do about it:
- Use tracemalloc to track memory allocation and find which lines of code are responsible.
- Check out gc and objgraph for visualizing what's not getting collected.
- Limit the lifespan of objects by keeping scopes tight and using local variables whenever possible.
Memory Leaks in Java
Java’s garbage collection is powerful, but it’s not magic. Just because memory is managed doesn’t mean leaks won’t happen; they just tend to be more subtle.
A common issue is static variables. Once something is static, it remains in place for the lifetime of the application. If you’re storing large objects, maps, or collections there, that allocated memory won’t be freed even if it’s no longer needed.
Another sneaky source of leaks is non-static inner classes. These keep an implicit reference to their outer class, which can keep your entire object graph alive when it shouldn’t be.
And then there are listener leaks, such as forgetting to unregister an event listener, which can lead to lost pointer references. The listener keeps your object in memory, even if everything else is done with it.
How to catch Java leaks:
- Use VisualVM or Java Mission Control for monitoring.
- Analyze heap dumps with Eclipse MAT to find unreachable memory.
- Look for unclosed streams, leftover static references, and long-living caches.
Memory Leaks in C++
In C++, memory management is all on you. If you allocate memory with malloc() or new and forget to free() or delete, you’ve got yourself a memory leak. Unlike garbage-collected languages, in which allocated memory is gone until your program terminates, no cleanup happens behind the scenes.
Even worse: if you lose the pointer entirely (overwrite it, or it goes out of scope), you can’t even track what leaked.
Another big risk comes from exceptions. If something throws before you free memory, your cleanup code might never run.
How to stay safe in C++:
- Use Valgrind to detect memory leaks and track your heap allocation.
- Compile with AddressSanitizer it’s fast and very good at spotting leaks.
- Stick to RAII patterns. When your resources are tied to object lifetimes, cleanup is automatic and safer.
Memory Leaks in Google Chrome
Yes, even your browser can leak memory, especially if you're working with JavaScript-heavy web apps or browser automation tools like Playwright or Puppeteer.
One of the most common issues is detached DOM nodes. For example, if you remove a DOM element from the page but your code still holds a reference to it, that element stays in memory. Over time, this can consume a significant amount of RAM.
Timers are another one to watch. If you use setInterval() or setTimeout() and forget to clear them, the background tasks will continue running and consuming memory.
How to investigate leaks in Chrome:
- Use the Memory tab in Chrome DevTools to take snapshots and watch how memory usage grows.
- Check for detached DOM trees or retained JS objects.
- Use the Performance tab to profile sessions and identify scripts or components that are leaking over time.
If you're performing browser automation at scale, especially with tools like Browserless, it's crucial to closely monitor memory and avoid creating a new browser or context for every test. Reuse whenever possible to keep your memory consumption in check.
Conclusion
Memory leaks are just another bug in your software that can consume precious space, and like any bug, they can be identified, fixed, and prevented with the right tools and habits. Regardless of the language or platform you’re using, tracking memory allocation, cleaning up unused references, and monitoring your memory usage over time can help prevent long-term performance issues. Whether you're debugging a slow-running Playwright script or tracing heap issues in C++, consistent memory hygiene pays off. If you’re running browser automation at scale and want to avoid the headache of chasing leaks. In that case, Browserless has built-in monitoring, session management, and leak-prevention tools that do the heavy lifting. Sign up for a free trial and see the difference clean memory makes.
FAQs
What is a simple example of a memory leak in code?
A simple example of a memory leak is a loop that continually adds data to a list or array without clearing it. For instance, in Python:
leaky_list = []
while True:
    leaky_list.append("leak")
This snippet continually allocates more memory with every iteration but never releases it. Over time, your program’s memory usage increases until the operating system terminates the process or your application is shut down due to a lack of resources.
How do memory leaks affect other programs running on the same machine?
If a single program is leaking memory, it can quickly consume a large portion of the system’s available memory. That means other programs running on the same server or machine may slow down, crash, or start throwing exceptions. It's like one noisy neighbor using all the water in an apartment building; everyone else pays the price.
What kind of programming errors usually lead to memory leaks?
Some of the most common programming errors that cause memory leaks involve keeping objects around when they’re no longer needed. This could include holding unnecessary references in global variables, forgetting to clear timers or background tasks, or failing to free memory after dynamic allocation in lower-level languages like C++. These small mistakes can lead to large-scale memory consumption over time.
Does malloc always need a corresponding free?
Yes always. In C and C++, every malloc() or calloc() must be matched with a free() call. Otherwise, that chunk of allocated memory stays in the heap even after your program is done using it. If this pattern continues, your program continues using memory that can’t be reclaimed until the program terminates, which is the definition of a memory leak.
Can arrays cause memory leaks?
Absolutely. While arrays themselves aren’t bad, how you manage them matters; if you fail to remove or clear unused elements, you’re at risk of leaking memory. If you dynamically grow an array (especially in JavaScript or C++) and don’t remove or clear unused elements, you're at risk of leaking memory. Additionally, circular references in array objects can prevent them from being reachable by garbage collection, resulting in unreachable memory that can’t be reclaimed.
Why do memory leaks sometimes go unnoticed until performance drops?
That’s the tricky part; memory leaks often don’t cause obvious problems until much later. Your program runs fine at first, but as the leak grows, you start to see slowdowns, increased RAM usage, or random crashes. By the time it becomes severe, you may have lost track of which part of the code caused it. That’s why regularly using profiling tools and monitoring your heap is so important, especially for long-running processes.