
It's what every Node developer fears: the process that keeps eating memory and won't stop, or the infamous ENOMEM code being returned by your child_process calls. That's right we're talking about memory leaks today folks, and more specifically the NodeJS kind.
However, instead of taking a look at all the tools and packages out there, and going over each, I'd like to share the things that we used that directly lead us to find our particular leak. Unfortunately this will require you to install at least one package in your app and call it somehow, whether that be on a regular interval or via a triggered event of some kind. In any event, below is how we found, diagnosed, and fixed a particular memory leak that caused us some headaches in browserless.
Install heapdump
The first thing we reached for was the npm package heapdump. This little utility generates portable heapsnapshot's of V8's heap, which you can then directly import later into Chromium to debug (more on that later).
As for browserless, we decided to conditionally mount a route that exposes this functionality. The internals for heapdump are a little goofy since it has to write to disk, so you'll have to take that into consideration for your use-case.
The heapdump route
You'll notice that we handle all the of details of the writing, sending, and deletion of this heap file. Be warned that the heapdump.writeSnapshot call is expensive as it effectively stops the single-process JavaScript runtime so that a dump can be made. This means that this isn't something you want to run on all your production machines -- and I wouldn't do so on any production machine.
By no means should you run this route in your production infrastructure!
For our purposes in debugging this leak, we instead built local docker images to hammer with traffic for the sole purpose of finding this issue. If this isn't an option, or if you don't have a way to test these changes in some kind of isolation, then you have bigger problems than a memory leak on your hands. We can't stress this enough: find a way to implement this in an isolated fashion.
Good? Now let's run some traffic!
Make some traffic
For browserless, since we expose a interface for puppeteer and playwright to hook into, we spun up our docker image with the below command:
Obviously you'll need to start your application with whatever it needs in order to run. After we got up and running, we did a cURL call to to our /heapdump route and got our first heapsnapshot. It's really important to get a "clean" snapshot before any processing or traffic happens, as we use this as a baseline for comparing later snapshots. It's nearly impossible to find a leak with doing some kind of comparison.
Now that we have our app up, and a baseline snapshot for comparing, let's run generate some traffic. For our purposes we simply wanted to generate a lot of connections and removals to see if that invoked our memory issue. This let us try out thousands of sessions to see if there was an issue in how we collect statistics of the machine itself, or if something else was at play.
Simulate load
Once done, you'll simply have to wait. Depending on your case this could take a few minutes or even hours, so let things run for a bit and come back once you've got enough load generated.
OK! Time's up! Let's get our second snapshot for comparison:
Load up your Chrome browser
If you're unfamiliar with devtools on Chrome, then this is the part where I say go watch a few videos on that (seriously). Both NodeJS and Chrome share the same-ish V8 runtime, which means you can do cool stuff like profile and debug Node applications with Chrome! But in order to do that you'll need to have some familiarity with it, so please go do so now!
Once you're ready, open a new tab. The about:blank page is good as nothing happens on it, keeping everything clean. Once done open devtools.
DevTools link
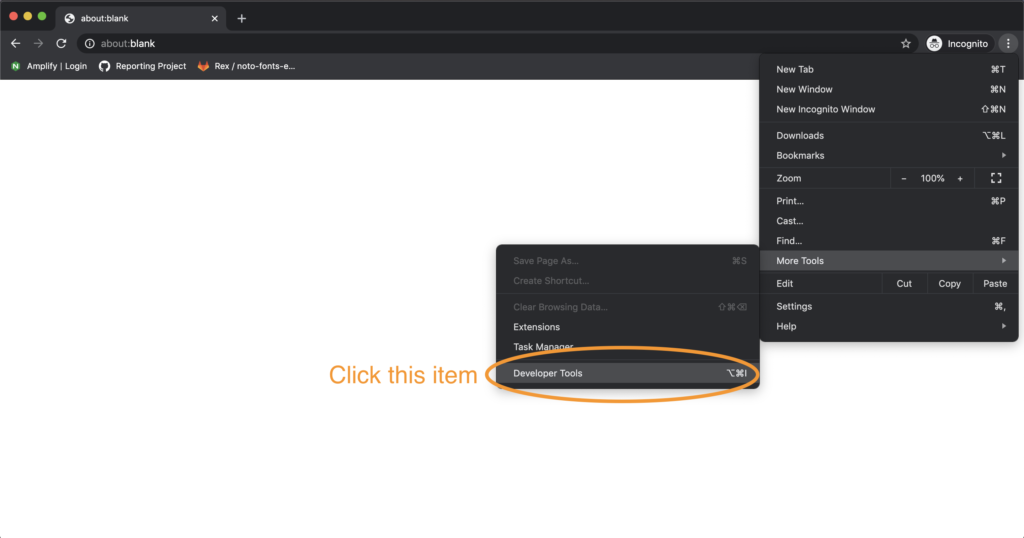
After that you'll want to click the Memory tab to open the comparison tool we're after.
Memory Tab
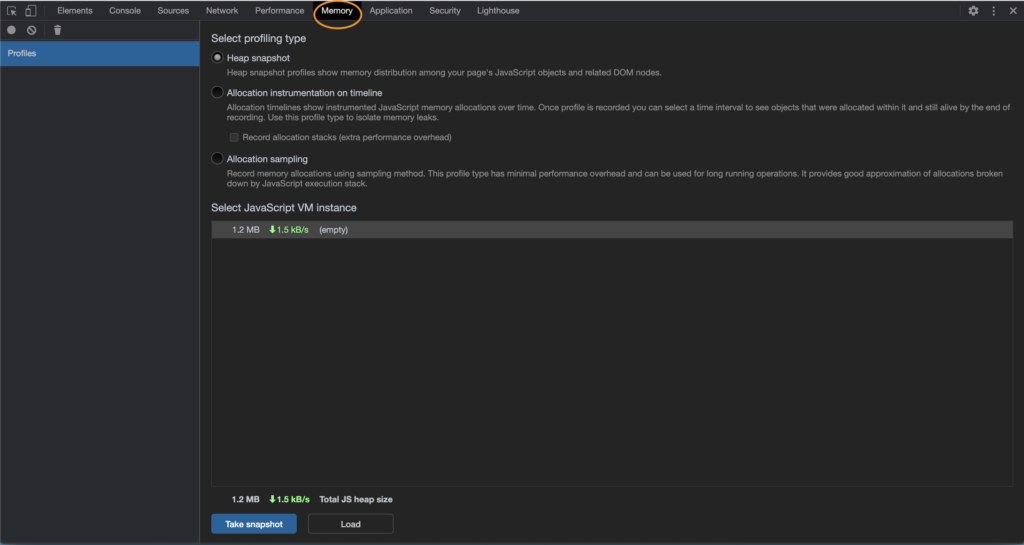
Down below, you'll want to click that "Load" button the bottom of the frame. What this does is allow you to load the existing snapshots we've made into Chromium's debugger. You'll have to do each snapshot individually, and renaming them is helpful so you know when they were taken. In our case, we had both start and end snapshots, so it made it easy for us to distinguish what was what.
Once you've loaded all your snapshots, your a few clicks away from more information than you can possibly ever need. Start by clicking the last snapshot in time (for us the end one). Then click the "Summary" tab and change it to "Comparison". Finally, sort by "Size Delta" ensuring that the biggest is first, or descending order.
Comparison view
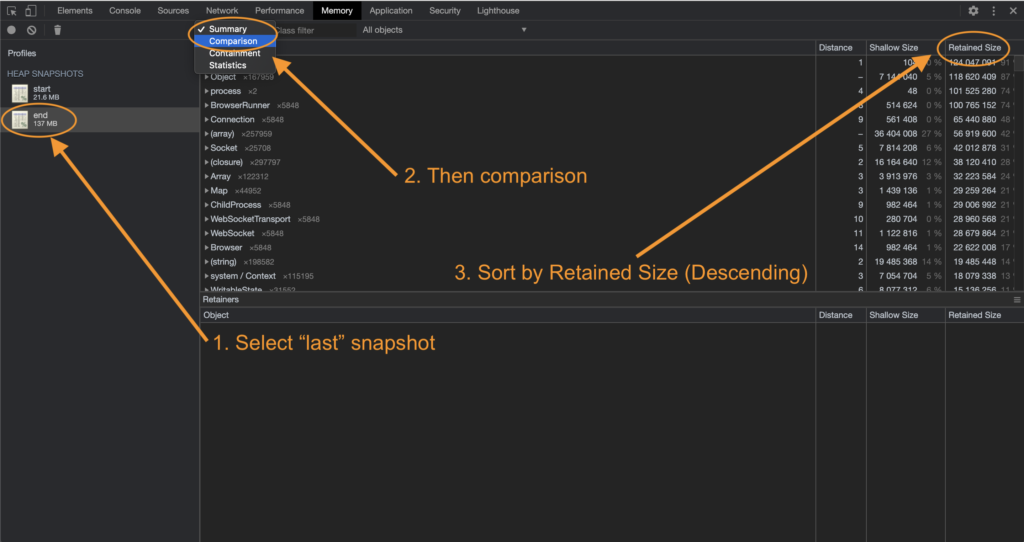
What we're after here is Objects that are growing over time and never collected. In plain language, we're essentially telling Chrome that we want to compare these snapshots, and show us objects that have grown over time and are never collected.
Once done, you'll want to start clicking around the bottom half the page (Retainers). This give us some context on what it is that's growing and never being reaped.
Leak location
This next part, I'll admit, is somewhat confusing. We're essentially looking for anything in these never-collected objects that might trigger our "spider-sense" that there's an issue. Some of it is internal to Node, which will look like complete gibberish, and it's quite possible that your leak is in some other library or package. There's a lot of system strings that are quite biggish (which are your modules loaded into memory), so be sure to not get suspicious of those. It took us quite a bit of digging around, but the leak is found here:

You'll notice that we instinctively clicked on the first item in this array object, and we're presented with a bunch of Objects below. Looking again at the "Retained Size", we immediately spotted that there's a huge SIGHUP object staying around. This is made even more clear by the fact that the lower "Retained Size" column is showing that these objects never get reaped again.
Clicking around, we also noticed that some other growing objects referenced these SIGHUP objects as well. Since browserless itself doesn't handle this signal, something somewhere must be. After searching around our node_modules libraries we found one culprit: puppeteer.
Fixing the leak
Now, puppeteer isn't directly responsible for this issue, however it does attach a lot of process handlers (not just SIGHUP, but exit and others). These do get closed when calling browser.close() -- which wasn't something that we were doing! Instead, we disconnected from the browser, and sent our own process kill message to it. When running many instance of puppeteer in a server environment, this becomes problematic, especially in docker.
In docker, we do signal handling manually by binding our own event listeners and forwarding that intention to all running browser instances in order to close gracefully. Once done, we then exit the process, meaning that puppeteer doesn't really need to handle any of that for us. Luckily their API exposes what events to bind to except for the exit event. This means that we fixed this leak by doing the following:
- Telling puppeteer not to handle signals (see their API here).
- Triggering its event cleanup process by using
browser.closeinstead ofbrowser.disconnect. - Since the
exithandler isn't always reaped bybrowser.close()in cases of crashes, we force it by periodically callingprocess.removeAllListeners('exit'). Be careful with this one, it's a ham-fisted way to make sure exit events get removed, and can cause issues if other parts of your app are expecting this. We'll be adjusting this once we find a better mechanism for doing so.
Final thoughts
Going forward you can prevent a lot of memory issues by following best-practices in Node. Removing events when done, null-ing old references and cleaning up long arrays are great ways of ensuring your app is lite on memory. In times of peril these aren't necessarily helpful, however, and you'll need to to snapshot V8 directly and do some comparisons to find where your issue is.