
TL;DR
- Two different jobs. Puppeteer performance covers how fast your automation workflow runs and how you use Puppeteer to measure a web page's own load speed.
- Fix the lifecycle first. Reusing one browser, blocking requests you don't need, waiting on real conditions, and capping concurrency fix most slow scripts.
- Measure, then scale. Chrome traces and Web Vitals turn "it feels slow" into a number, and a managed browser service takes over at scale.
Introduction
You start a Puppeteer job, go grab a coffee, and come back to find it on page 40 of 5,000, which is usually when Puppeteer performance stops being someone else's problem. In most cases the slowdown comes from how the browser is handled, not your scraping logic, whether that's a fresh launch for every URL, fixed timeouts the page never needed, or tabs left open until memory runs out.
This guide covers those fixes first, then shows how to use Puppeteer to measure page speed, and what to do once one machine can't keep up.
What affects Puppeteer performance?
Puppeteer is a Node library with a high-level API to control headless Chrome (and, more recently, Firefox).
Whether you're using it for web scraping, browser automation, or testing web apps, the same few things decide how fast it runs:
- Browser launch time. Starting Chromium is one of the slowest steps in a short script, so paying for it once per URL adds up fast.
- Network requests. Every image, font, stylesheet, and third-party script on the page is something
page.goto()waits on. - Waiting strategy. Fixed delays waste time when the page is ready early and fail when it's ready late.
- Memory use. Pages and contexts you forget to close keep their DOM and JavaScript heap around until the process slows down or crashes.
- CPU contention. Parallel execution means every page shares the same cores, so past a certain point adding more pages makes the whole batch slower.
Puppeteer performance best practices
The fixes below go through those factors in order, and you can apply all of them to the script you already have.
Reuse the browser instead of relaunching it
If your script calls await puppeteer.launch() once per URL, you're paying for a full Chromium startup every single time. Launch one browser up front instead, and create a separate browser context for each task. A context is a lightweight, isolated session inside that browser, a bit like an incognito window.
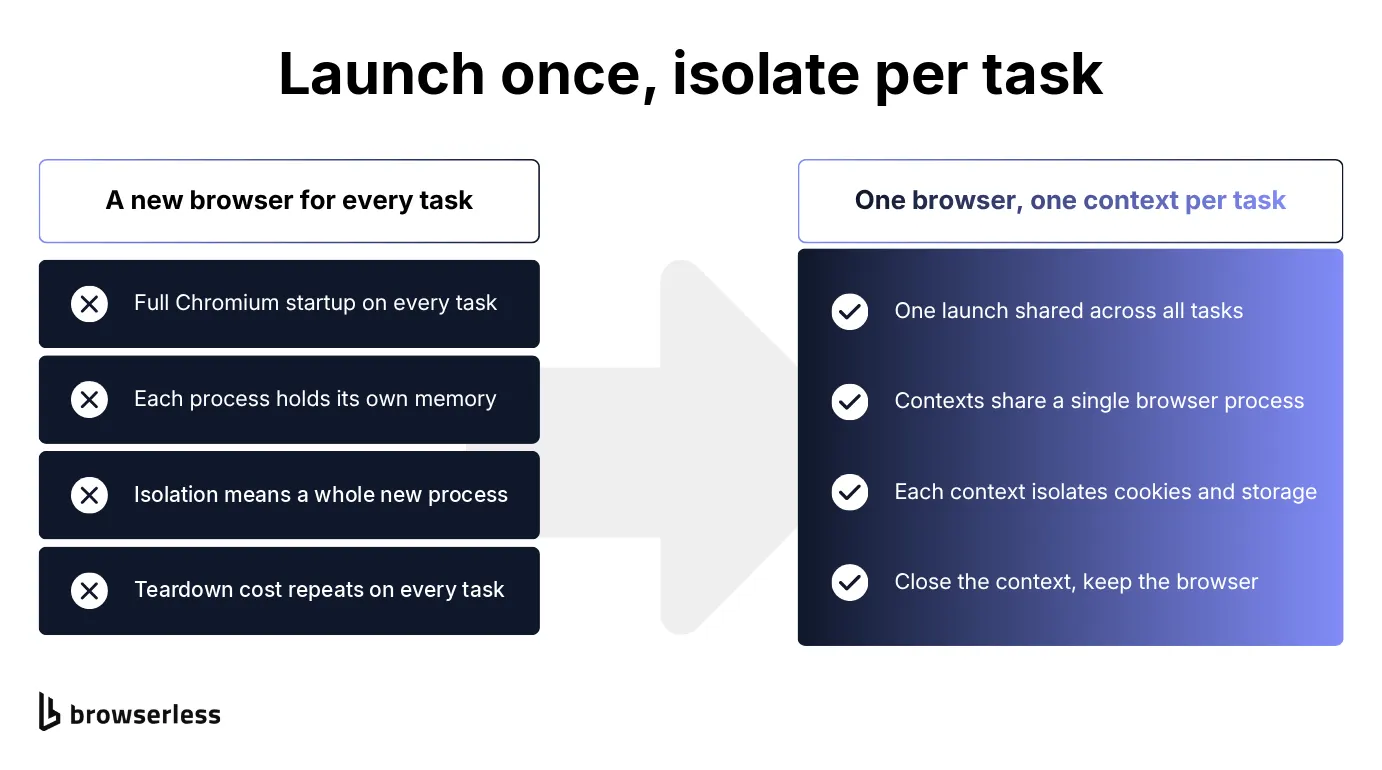
In the code below, the browser launches once, a runTask() helper opens and closes a context around each URL, and two tasks share the same browser. You'll see browser and runTask() again in later examples:
import puppeteer from "puppeteer";

const browser = await puppeteer.launch({ headless: true });

async function runTask(url) {
  const context = await browser.createBrowserContext();
  try {
    const page = await context.newPage();
    await page.goto(url, { waitUntil: "domcontentloaded" });
    return await page.title();
  } finally {
    await context.close();
  }
}

try {
  const results = await Promise.all([
    runTask("https://example.com"),
    runTask("https://example.org"),
  ]);
  console.log(results);
} finally {
  await browser.close();
}
Each task gets its own cookies and local storage, so nothing leaks from one run into the next. The finally blocks are essential too. The inner one closes the context even when a navigation throws, which is exactly when cleanup tends to get skipped, and the outer one guarantees await browser.close() runs once every task is done.
Cut unnecessary network requests
Most scraping jobs never use the images or fonts a page loads, and plenty can skip the stylesheets too. With request interception enabled, Puppeteer holds every outgoing request until your handler either aborts it or lets it through. Here's a page in a fresh context on the same browser that drops the four heaviest resource types:
const context = await browser.createBrowserContext();
try {
  const page = await context.newPage();
  await page.setRequestInterception(true);

  page.on("request", (request) => {
    const blockedTypes = ["image", "font", "stylesheet", "media"];
    if (blockedTypes.includes(request.resourceType())) {
      request.abort();
    } else {
      request.continue();
    }
  });

  await page.goto("https://www.wikipedia.org", { waitUntil: "networkidle2" });
} finally {
  await context.close();
}
HTML and JavaScript still come through, so the DOM builds and your selectors work as usual. The catch is anything visual. Screenshots, layout checks, and scripts waiting on an image's load event all break once those assets are gone. A structured-data scraper rarely misses CSS, but a visual regression test needs nearly all of it.
Different scenarios need different assets, so scope the block list per task rather than setting it once globally. On the Browserless REST APIs, the same idea is the rejectResourceTypes option (with rejectRequestPattern for URL patterns), covered in the walkthrough on optimizing Puppeteer automations blog post.
Wait on the right signal, not an arbitrary delay
A hard-coded setTimeout is slow and unreliable. Make it too short and the page isn't ready yet, too long and every run pays for it. Wait for the thing your next line actually needs. For a Wikipedia search, that's the results list becoming visible:
await page.goto(
  "https://en.wikipedia.org/w/index.php?search=headless+browser&fulltext=1",
);
await page.waitForSelector(".mw-search-results", { visible: true });
An await page.waitForSelector() or await page.waitForFunction() call resolves as soon as its condition is true, so you never wait longer than you need to. They're also the fix for tests that pass locally and fail randomly in CI, which is usually a fixed timeout meeting a slower network.
Close what you open to keep memory use flat
The finally blocks from the first example already close each context, and any page you open outside one needs the same treatment. For a page that stays open across many actions, log its heap to the console as it works so you can see whether memory holds steady:
const metrics = await page.metrics();
console.log(`JS heap used: ${Math.round(metrics.JSHeapUsedSize / 1024 / 1024)} MB`);

await page.close();
page.metrics() gives you a cheap runtime snapshot, including JSHeapUsedSize, DOM node count, and event listener count, with none of the overhead of a trace. A flat heap is what you want. One that climbs with every action is a leak, and it'll take the process down eventually. Each task's fresh page starts with a clean heap, though, so it can't show memory piling up in the browser itself. For that, watch the Chrome process's memory across tasks in your container metrics, or in ps using browser.process().pid when you launch locally.
If you run Puppeteer in Docker, watch shared memory too. Docker gives /dev/shm just 64 MB by default, and when Chrome runs out you don't get a clean error, just tabs crashing under load in that environment. Raise the limit with --shm-size=2g on docker run. If you can't, --ipc=host shares the host's memory instead. Treat Chrome's --disable-dev-shm-usage flag as a last resort, since it moves shared memory to /tmp and slows page loads.
Parallelize, but cap your concurrency
Parallel pages speed up a batch, right up until they don't. Fire off a Promise.all() over a thousand URLs and every page fights the others for CPU and memory. A concurrency cap keeps you in the range where more pages still means more throughput, and p-limit gives you one in a few lines. Wrap each runTask() call in it and no more than five run at once:
import pLimit from "p-limit";

const limit = pLimit(5);
const urls = ["https://example.com", "https://example.org" /* ... */];

const results = await Promise.all(urls.map((url) => limit(() => runTask(url))));
Every URL still goes into Promise.all(), but limit() holds the extras in a queue and starts the next one only when a slot frees up. Five is a good guideline to start from on a modest machine. From there, raise it against your own hardware configurations and pages, and keep an eye on memory, since it often runs out before CPU does.
More concurrency also means a crash hurts more. One dead Chromium process stalls every task waiting on it, so check browser.connected or listen for the disconnected event and relaunch automatically rather than letting the whole batch hang.
Check your Puppeteer version before blaming your code
Newer isn't always faster for your workload, and a Puppeteer version benchmarking project found real swings between releases on tasks like screenshots and PDF generation.
If a script is still slow after all that, the guide to fixing slow Puppeteer scripts covers a few less common techniques, including filtering out targets you never interact with.
Puppeteer performance testing for web apps
Puppeteer performance testing flips the question. You're no longer making the script faster. You're using the script to find out how fast a page feels to the people loading it.
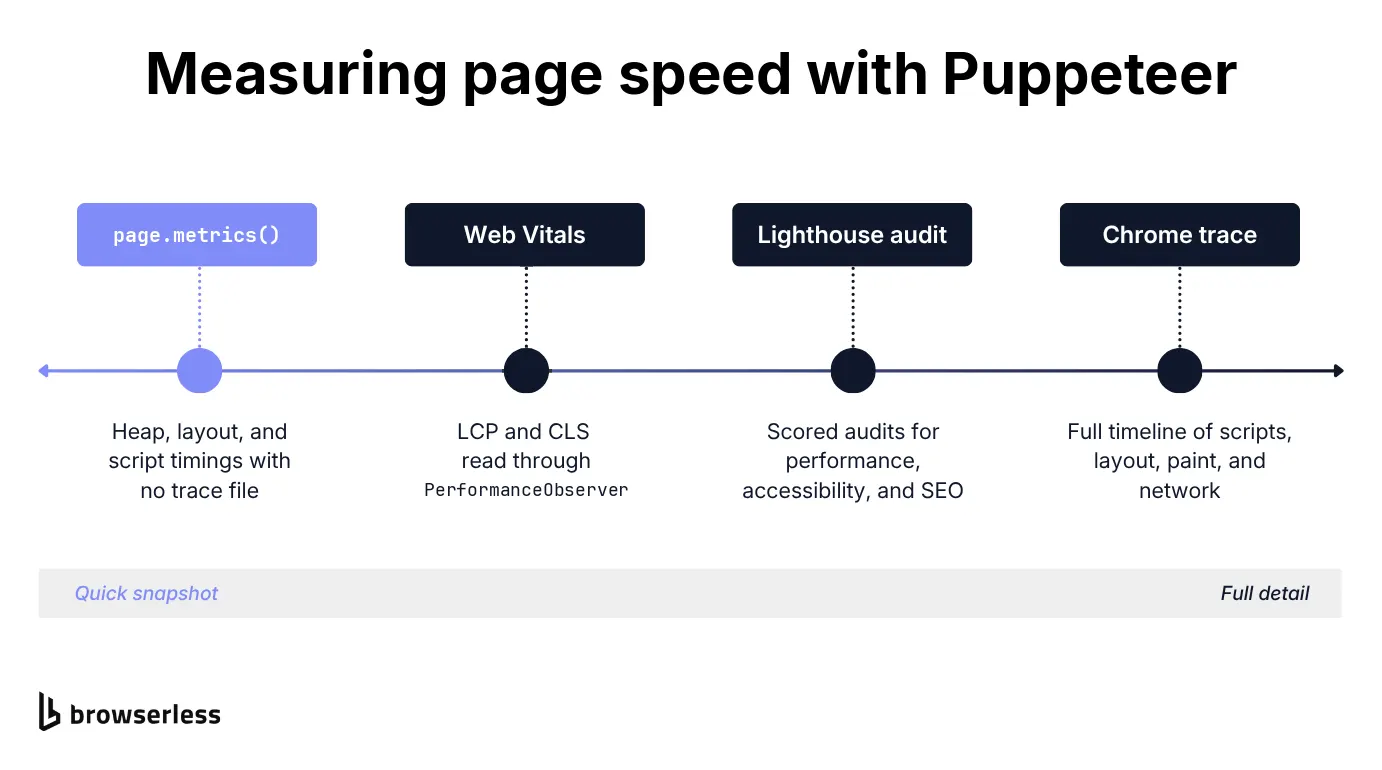
Start with the page.metrics() snapshot from the memory section, which also reports layout count and script duration. When it tells you something's wrong but not what, reach for a Chrome trace. Puppeteer can start tracing before a navigation or interaction, stop it afterward, and save everything the browser did in between to a JSON file. Tracing a single page load with screenshots looks like this:
import puppeteer from "puppeteer";

const browser = await puppeteer.launch();
const page = await browser.newPage();

try {
  await page.tracing.start({ path: "trace.json", screenshots: true });
  await page.goto("https://example.com", { waitUntil: "networkidle0" });
  await page.tracing.stop();
} finally {
  await browser.close();
}
Drag the resulting trace.json into the Performance panel in Chrome DevTools and you get JavaScript, layout, paint, and network activity on one timeline. That's where deeper performance analysis happens. You can see whether the slow part is a long task, a slow API call, or too much layout work.
Neither tool measures the page from the user's point of view, though. Core Web Vitals like Largest Contentful Paint (LCP) and Cumulative Layout Shift (CLS) do, and you can read them from the browser's own PerformanceObserver API. Inject the observers on a fresh page before navigating so they're running for the whole load:
await page.evaluateOnNewDocument(() => {
  window.__vitals = { lcp: 0, cls: 0 };

  new PerformanceObserver((entryList) => {
    const entries = entryList.getEntries();
    window.__vitals.lcp = entries[entries.length - 1].startTime;
  }).observe({ type: "largest-contentful-paint", buffered: true });

  new PerformanceObserver((entryList) => {
    for (const entry of entryList.getEntries()) {
      if (!entry.hadRecentInput) {
        window.__vitals.cls += entry.value;
      }
    }
  }).observe({ type: "layout-shift", buffered: true });
});

await page.goto("https://example.com", { waitUntil: "networkidle0" });

const vitals = await page.evaluate(() => window.__vitals);
console.log(vitals);
evaluateOnNewDocument() runs before any of the page's own scripts, and buffered: true hands the observers any entries recorded before they attached. Once the page settles, page.evaluate() pulls the numbers back into Node.js.
Both numbers are close approximations rather than the official metrics. The CLS here is a running total of every shift without recent input, while the official metric only counts the largest burst of shifts, and LCP has edge cases of its own. When you need numbers that match Google's definitions, load the web-vitals library's onLCP() and onCLS() into the page instead.
Prefer Lighthouse scores (performance, accessibility, SEO) over hand-rolled metrics? The Browserless Lighthouse performance API runs those audits in parallel, one POST request per page, so you don't have to wire up the Lighthouse Node API yourself.
Keep in mind that all of these, Lighthouse included, are lab numbers from one machine on one network. They're great for fast feedback on regressions between deploys and for profiling a single user flow, but they won't replace real-user monitoring.
Where to run Puppeteer browser automation at scale
At some point one machine runs out of room, and the problem stops being your script. It becomes the browsers underneath it. You've got three realistic options from there.
Self-managed containers or VMs give you full control. You run Puppeteer in Docker or on your own VMs, and you also own the upkeep, from memory tuning to browser upgrades. That's fine if you already have the systems and the people to run it, and expensive if you don't.
Serverless functions are great for short, bursty, single-page jobs, since you only pay for the seconds you use. Long-running or high-concurrency work is another story. Cold starts bring back the exact launch cost you just worked to remove, and most platforms cap execution time.
Managed cloud browser services take the fleet work off your hands. Browserless is one of them, and it's the browser layer from this guide, hosted.
Your script connects to a remote browser over a WebSocket instead of launching its own browser, so the main change is swapping puppeteer.launch() for puppeteer.connect() and adding your API key:
import puppeteer from "puppeteer";

const browser = await puppeteer.connect({
  browserWSEndpoint: `wss://production-sfo.browserless.io/chromium?token=${process.env.BROWSERLESS_API_KEY}`,
});

try {
  const context = await browser.createBrowserContext();
  const page = await context.newPage();
  await page.goto("https://example.com", { waitUntil: "domcontentloaded" });
  console.log(await page.title());
} finally {
  await browser.close();
}
Everything else, including the contexts and request interception from earlier, works the same against the remote browser. The runTask() helper carries over as-is: connect once, then open a context per task. It won't load a single page faster than a well-tuned local setup, since it's the same browser doing the same work.
What Browserless removes is the work around the page. There's no Chromium to install and no /dev/shm to size, and browser versions stay updated without an image rebuild. Each connect() call also gets its own isolated browser, so you can run more sessions in parallel than one machine holds without one bad session dragging down the rest.
It also cuts launch cost between closely spaced runs. The Browserless.reconnect command keeps a session alive for a set window after you disconnect, so a run that starts within that window picks up the same browser, with its open pages and stored state intact, instead of launching and logging in again.
Pass timeout in the command's parameters to set that window in milliseconds. It can't exceed your plan's maximum session duration, and a larger value returns an error instead of a reconnect endpoint, so check for one before you let go of the browser. Call the command from any open page while the browser is still connected, then disconnect instead of closing. browser.close() ends the remote session, while browser.disconnect() leaves it running:
const cdp = await page.createCDPSession();
const { browserWSEndpoint, error } = await cdp.send("Browserless.reconnect", {
  timeout: 60000,
});
if (error || !browserWSEndpoint) {
  throw new Error(`Reconnect failed: ${error}`);
}
await browser.disconnect();

// Later, from the same or another process
const resumed = await puppeteer.connect({
  browserWSEndpoint: `${browserWSEndpoint}?token=${process.env.BROWSERLESS_API_KEY}`,
});
For state that has to survive hours or days, use persisted sessions instead.
The trade-off is latency, with every Puppeteer command now crossing the network, so a script that fires hundreds of tiny calls per page can run slower remotely than it did locally. Connect to the region nearest your code (production-sfo, production-lon, or production-ams), and for jobs that boil down to "load a page, return the result," the Browserless REST APIs run the whole job server-side in one HTTP call.
If you run the odd script from your laptop, you probably don't need any of this yet. If you spend more time on browser infrastructure than on the product you're building, it's worth a look.
Conclusion
Reuse the browser, wait on real conditions, and close what you open, and most Puppeteer scripts get fast enough. After that, going faster means running more sessions at once, and the work shifts to keeping all those browsers healthy.
Browserless handles that part, so you swap launch() for connect(), reconnect to a live session instead of relaunching when runs are close together, and let Browserless manage scaling and browser updates. To try it on your own workload, sign up for Browserless.
Puppeteer performance FAQs
Does headless mode make a Puppeteer script faster?
Usually, yes. Headless Chrome is lighter than a visible window, since nothing gets drawn to a screen. Puppeteer's default headless: true runs full Chrome, and if you don't need full Chrome functionality, headless: 'shell' switches to the leaner chrome-headless-shell, which Puppeteer's documentation describes as more performant for automation. The exception is websites that treat headless browsers differently, where you may need headful mode whatever it costs.
How much memory should I budget per Puppeteer page?
There's no single number. A blank page uses a fraction of what a heavy single-page app does. Measure a few of your real target pages, then size your concurrency cap around the heaviest one you expect, not the lightest.
Do these Puppeteer performance tips apply to web scraping?
Yes, and they matter most there. A web scraping job usually means hundreds or thousands of pages, so any per-page waste multiplies. That holds for anything you automate at volume, whether it runs as a standalone script or under a test framework. A concurrency cap does double duty here, since it also keeps your request rate reasonable for the sites you're scraping.
Do the code examples work in a CommonJS project?
They're written as ES modules with top-level await. In a CommonJS project, replace the import with const puppeteer = require('puppeteer'); and wrap the code in an async function, since top-level await only works in ES modules. Puppeteer's API calls stay the same.
Is Puppeteer faster than Playwright?
Sometimes, for short Chrome-only scripts, but the difference is small. Puppeteer talks to Chrome directly over the Chrome DevTools Protocol (CDP), while Playwright adds its own protocol layer so one API can drive Chromium, Firefox, and WebKit. In real workloads that gap mostly disappears behind network and rendering time, so the deciding question is how much cross-browser testing you need, WebKit especially.
The Playwright vs. Puppeteer comparison covers the rest of the trade-offs.
Is Puppeteer faster than Selenium?
For Chrome-only automation, typically yes. Puppeteer skips the separate WebDriver layer. Selenium wins on browser and language reach, which matters if your developers write tests in Java or C#. This three-way comparison shows how the three tools stack up.